Flood Plain, Flood Prone Area or Overland Flow Path? What Auckland Property Buyers (and Sellers) Need to Know
If you’ve ever opened a LIM report or Auckland Council’s Flood Viewer and found your dream home covered in blue shading, hatching or lines, you’re not alone. Auckland Council uses three different flood hazard labels, and they mean different things. Here’s how they differ and why it matters when you’re buying or selling.
Why Auckland has three flood layers
Auckland Council is required to keep hazard information publicly available. Flood plains, flood prone areas and overland flow paths are all published free online on Flood Viewer and Geomaps. They’re produced in different ways and answer different questions, so a property can sit in one, two or all three.
Flood plains: the modelled “big storm” picture
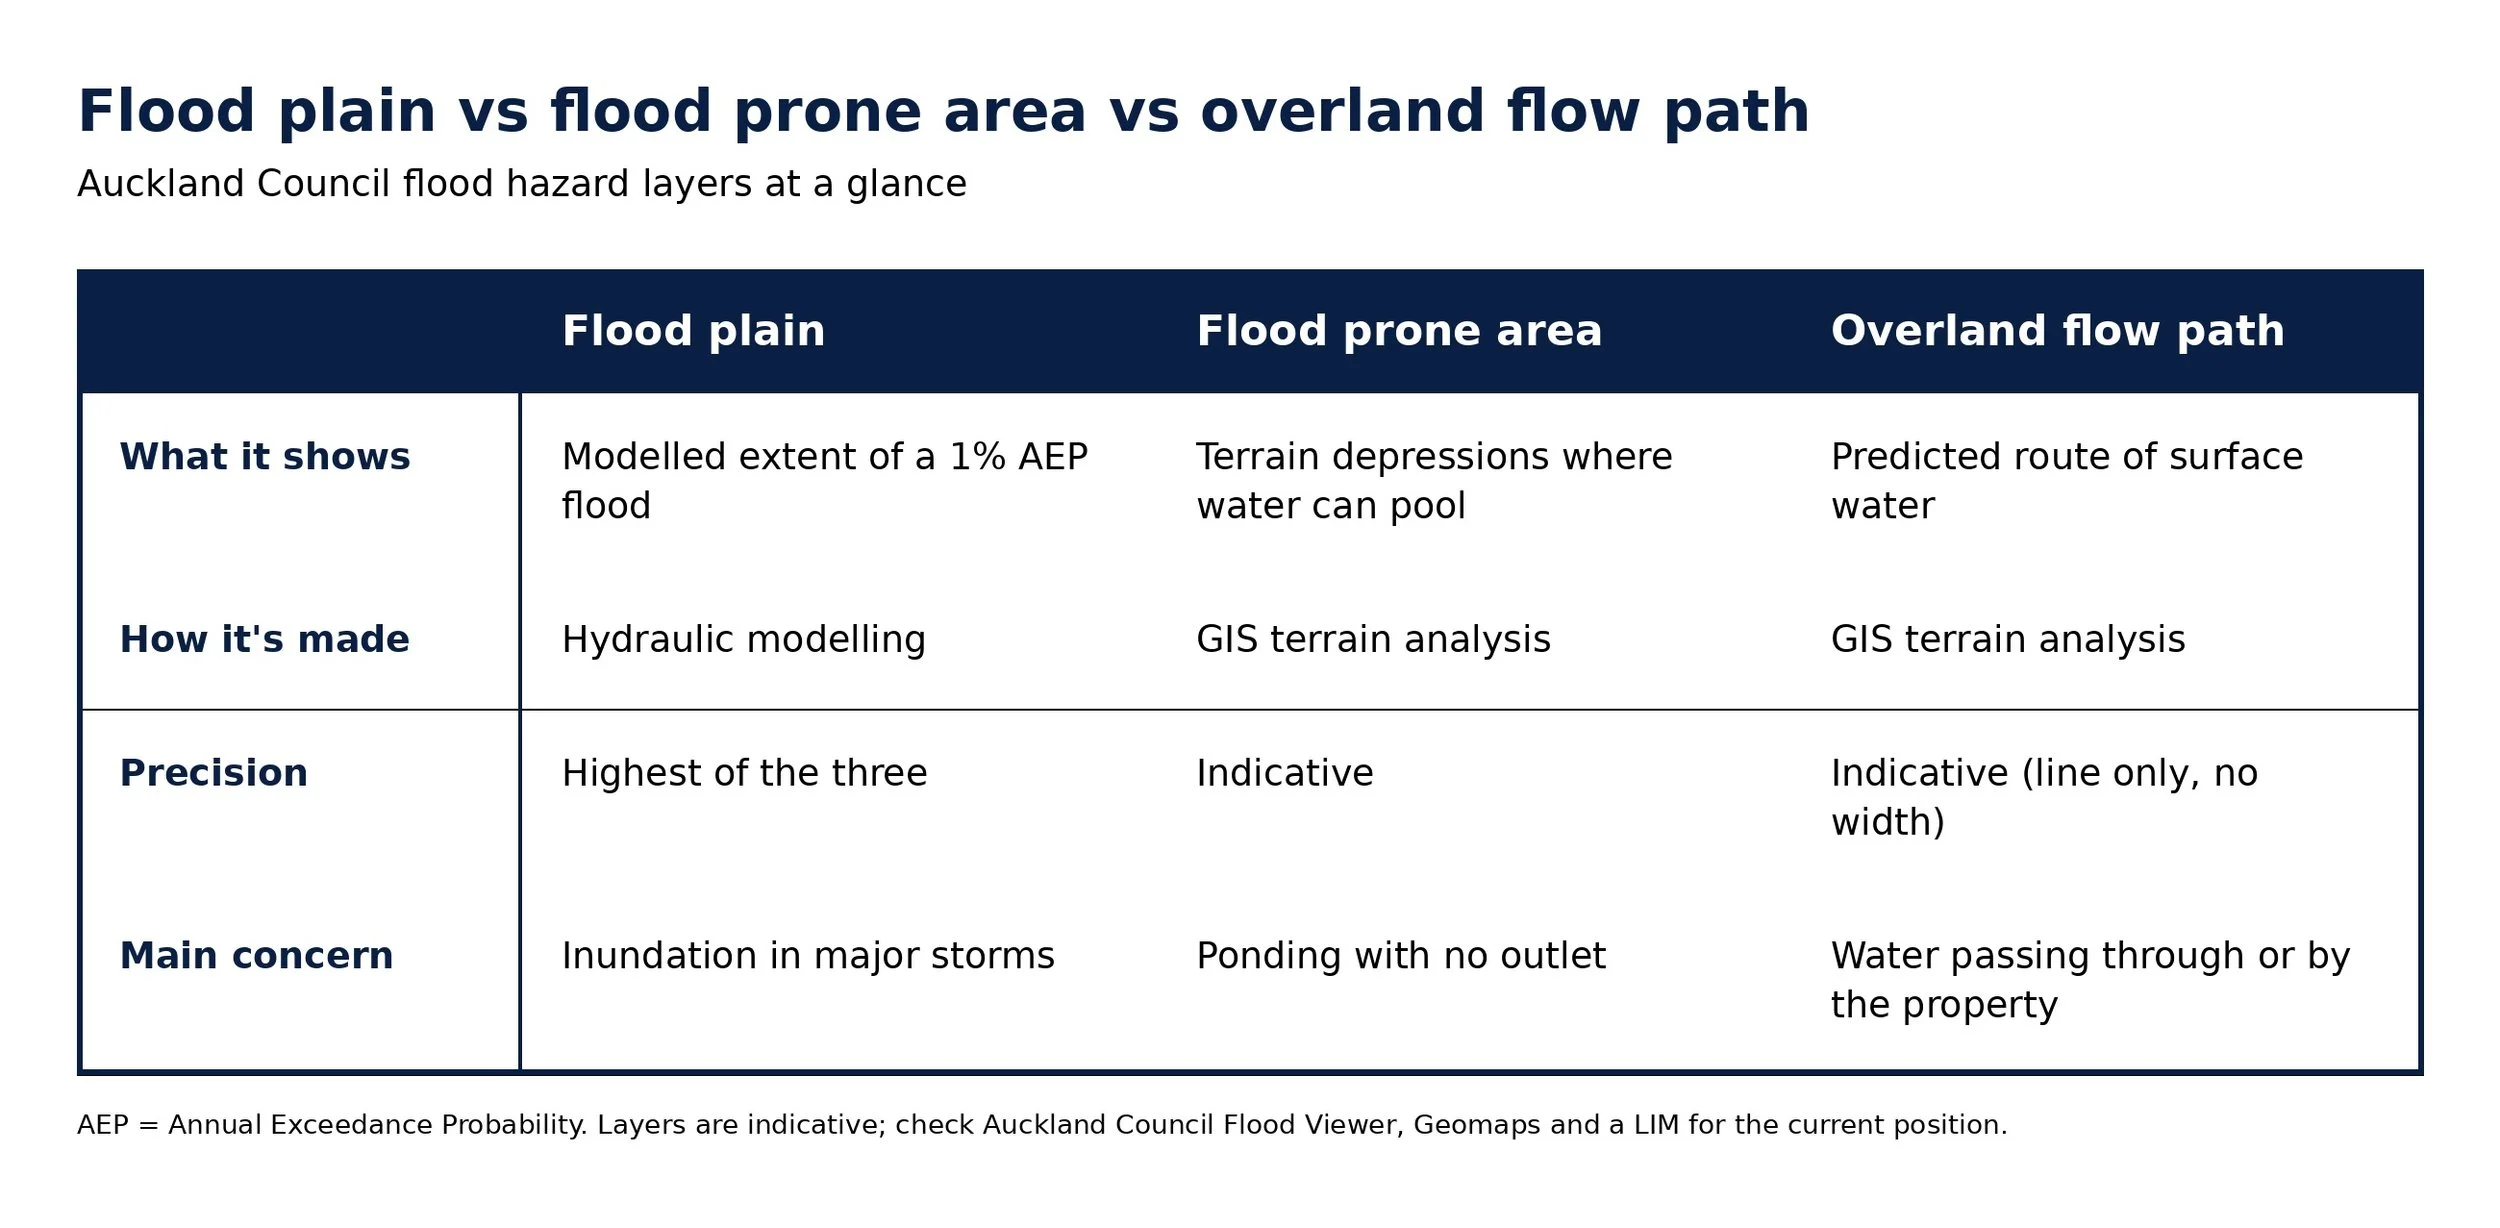
A flood plain is the most data-driven of the three. Council LIMs describe flood plains as the predicted area of land inundated by runoff from a 1% Annual Exceedance Probability (AEP) rainfall event. In plain English, that’s a storm with a 1% chance of happening in any given year, often called a “1-in-100-year” event. It doesn’t mean it happens once a century. You could see two in a decade.
Flood plains come from hydraulic modelling, and Council has been mapping them regionally on a regular update cycle since 2012.
You may also see a flood sensitive area. This is derived from the flood plain by adding 0.5m to the maximum predicted water level, and it’s an indicative layer. Council doesn’t have flood sensitive area information for all of Auckland.
What it means for you: A flood plain is the strongest signal that a site may be inundated in a major rain event, and it carries the most weight in planning rules and insurance conversations.
Flood prone areas: low spots where water pools
Flood prone areas are a different beast. They represent depressions in the terrain with no natural outlet. Think of a bowl: if water gets in and can’t drain, it collects. They’re identified using GIS techniques, not hydraulic modelling. They’re derived from analysis of a Digital Terrain Model.
Because they’re terrain-based, how much water actually collects depends on factors like the upstream catchment, rainfall and whether stormwater infrastructure is coping. They can be natural or created by man-made features such as road and railway embankments.
What it means for you: The layer tells you a site is in a spot where water can pool, but not how deep or how often. Development within a flood prone area may require a risk assessment. If you’re planning to build, extend or subdivide, factor that in early.
Overland flow paths: where water travels
Overland flow paths are about movement rather than pooling. They’re lines showing the predicted route of overland flow, based on terrain analysis. They don’t show the width or extent of flow and are indicative only. They matter because, when the piped network doesn’t exist or its capacity is exceeded, overland flow paths act as part of the secondary stormwater network.
A few things catch people out:
The path may start on someone else’s land. LIMs warn about the possibility of the site flooding, particularly from overland flow paths which may be on other properties.
A line is not a flood extent. The line is the centre of a predicted route, not a boundary. Water behaviour depends on rainfall and what’s on the ground.
Size thresholds apply. Under the Unitary Plan, very small catchments may not count. One consultant’s report notes that a flow path with a contributing catchment under 4,000 sqm isn’t considered an overland flow path under the Unitary Plan. Check the current definition if this matters for your site.
What it means for you: Overland flow paths are where building rules bite hardest in day-to-day terms. The Unitary Plan’s flooding chapter treats fences that don’t obstruct the path as permitted, but diverting the entry or exit point or reducing the capacity of any part of the path needs resource consent (restricted discretionary). Building a deck, retaining wall or garage across a flow path can be a real obstacle.
Quick comparison
What buyers should do
Check the maps first. Look at Auckland Council’s Flood Viewer or Geomaps before you make an offer.
Get a LIM. Checking the maps beforehand or purchasing a LIM are both recommended ways to understand a property’s flood hazards. The LIM tells you which layers intersect the title.
Look at the whole picture. Check upstream and neighbouring properties, not just the title boundary.
Ask about history. Past flooding, insurance claims and any stormwater work are worth asking about.
Talk to professionals. A building inspector, drainage engineer or your lawyer can help interpret what the maps mean for a specific property.
A word for sellers
Flood layers are public, and buyers’ lawyers will find them. It’s better to understand your property’s position before listing, and to be ready with plans, reports or evidence of any drainage work you’ve done.
One last caution
These three layers are separate from the post-2023 weather event “categories” and buyout processes, and from coastal inundation mapping, so don’t assume one tells you about the other. Flood maps are also updated over time, so always check the current versions rather than relying on an old screenshot or an old LIM.